Free interactive tools
Algorithm Visualizers
Practice common algorithm patterns in the browser with step-by-step state changes, highlighted decisions, and related tools for adjacent problems.
Use this hub for reusable problem-solving patterns
This collection is for choosing and understanding a general algorithmic technique: searching, sorting, scanning ranges, building dynamic-programming states, or exploring a decision tree.
Choose an algorithm visualizer by problem shape
Start with the structure in the input and the decision the algorithm repeats. These paths keep array, dynamic-programming, and search problems separate.
Search or reorder values
Use binary search for a target in sorted input, or a sorting visualizer to compare swaps, partitions, and merge steps.
Track a moving range
Use sliding window, two pointers, merge intervals, or a monotonic stack when the answer depends on a changing subarray or boundary.
Build an optimum from smaller states
Use dynamic-programming visualizers when each answer reuses previously solved states, choices, or table cells.
Explore a branching search space
Use recursion, backtracking, N-Queens, or minimax when the algorithm tries a choice and later accepts, rejects, or reverses it.
Compare common algorithm patterns
Choose the pattern from the shape of the input and the result you need. The complexity shown is the typical cost for the linked example, not a guarantee for every variation.
| Visualizer | Best for | Important constraint | Typical time |
|---|---|---|---|
| Binary Search Visualizer | Finding a target or boundary in sorted values | The input must be ordered before the search begins | O(log n) |
| Sliding Window Visualizer | Contiguous ranges whose left and right boundaries move | The answer must come from one continuous window | Usually O(n) |
| Two Pointers Visualizer | Pairs, partitions, or inward scans with monotonic movement | Pointer movement needs a rule that safely discards possibilities | Usually O(n) |
| Knapsack DP Visualizer | Optimising choices that reuse smaller solved states | Define the state and transition before filling the table | O(items × capacity) |
| Backtracking Visualizer | Enumerating constrained choices and undoing rejected branches | The search can grow exponentially without pruning | Problem-dependent |
Array and interval patterns
Step through sorted arrays, range preprocessing, window movement, pointer updates, interval merges, and stack-based scans.
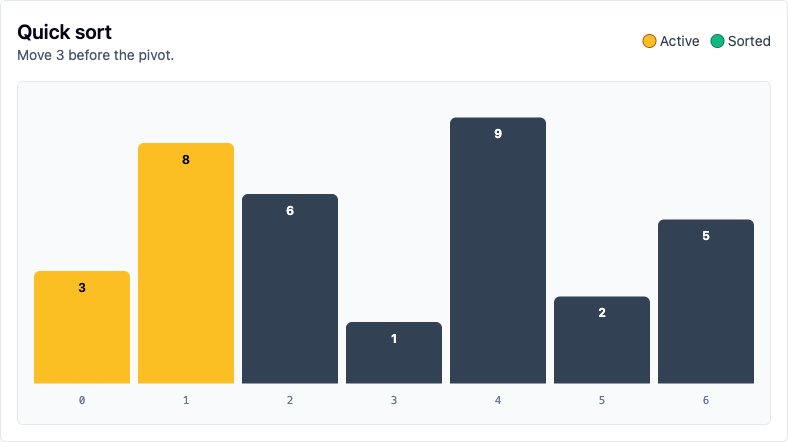 Sorting Algorithm Visualizer Visualize sorting algorithms online. Paste an array and step through bubble sort, insertion sort, selection sort, merge sort, or quick sort. Prefix Sum Visualizer Visualize prefix sum arrays online. Paste values, build cumulative sums step by step, choose a range, and inspect how range sum queries work. Sliding Window Visualizer Visualize sliding window algorithms online. Paste an array, run fixed-size or variable-size windows, and inspect left, right, sum, and best result. Two Pointers Visualizer Visualize two pointer algorithms online. Paste values, run sorted pair sum or container area, and inspect left and right pointer movement. Merge Intervals Visualizer Visualize merge intervals online. Paste interval pairs, sort by start value, step through overlap checks, and inspect the merged output. Monotonic Stack Visualizer Visualize monotonic stack algorithms online. Paste an array, choose next greater or previous smaller mode, and step through stack pushes, pops, and results.
Dynamic programming and recursion
Inspect table filling, recurrence choices, recursion trees, branching search, and game-tree decisions.
Trees, heaps, and range queries
Compare binary trees, search trees, balanced trees, heaps, trie prefixes, range structures, and overlap search.
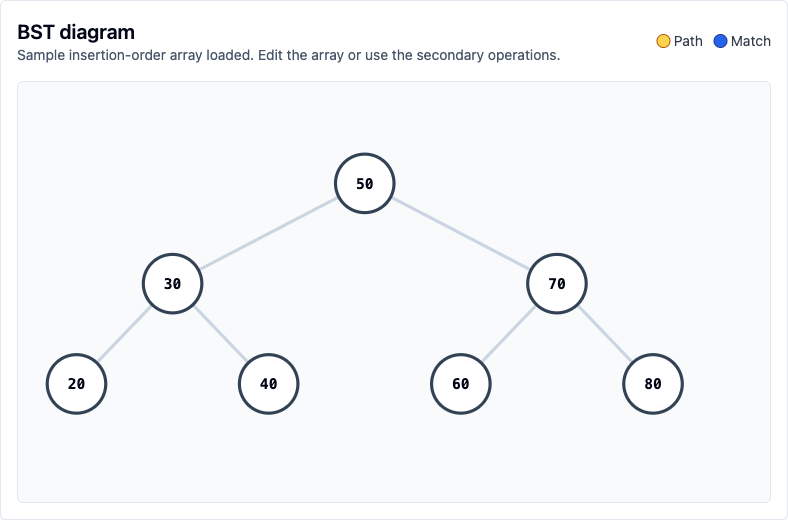 Binary Search Tree Visualizer Visualize binary search tree operations online. Paste an insertion-order array, render the BST, and run search, delete, insert, and traversal steps. AVL Tree Visualizer Visualize AVL tree insertion, search paths, balance factors, and rotations. Paste values and see a self-balancing binary search tree online. Red Black Tree Visualizer Visualize red black tree insertion online. Paste values, inspect node colors, rotations, recoloring, black height, and search paths.
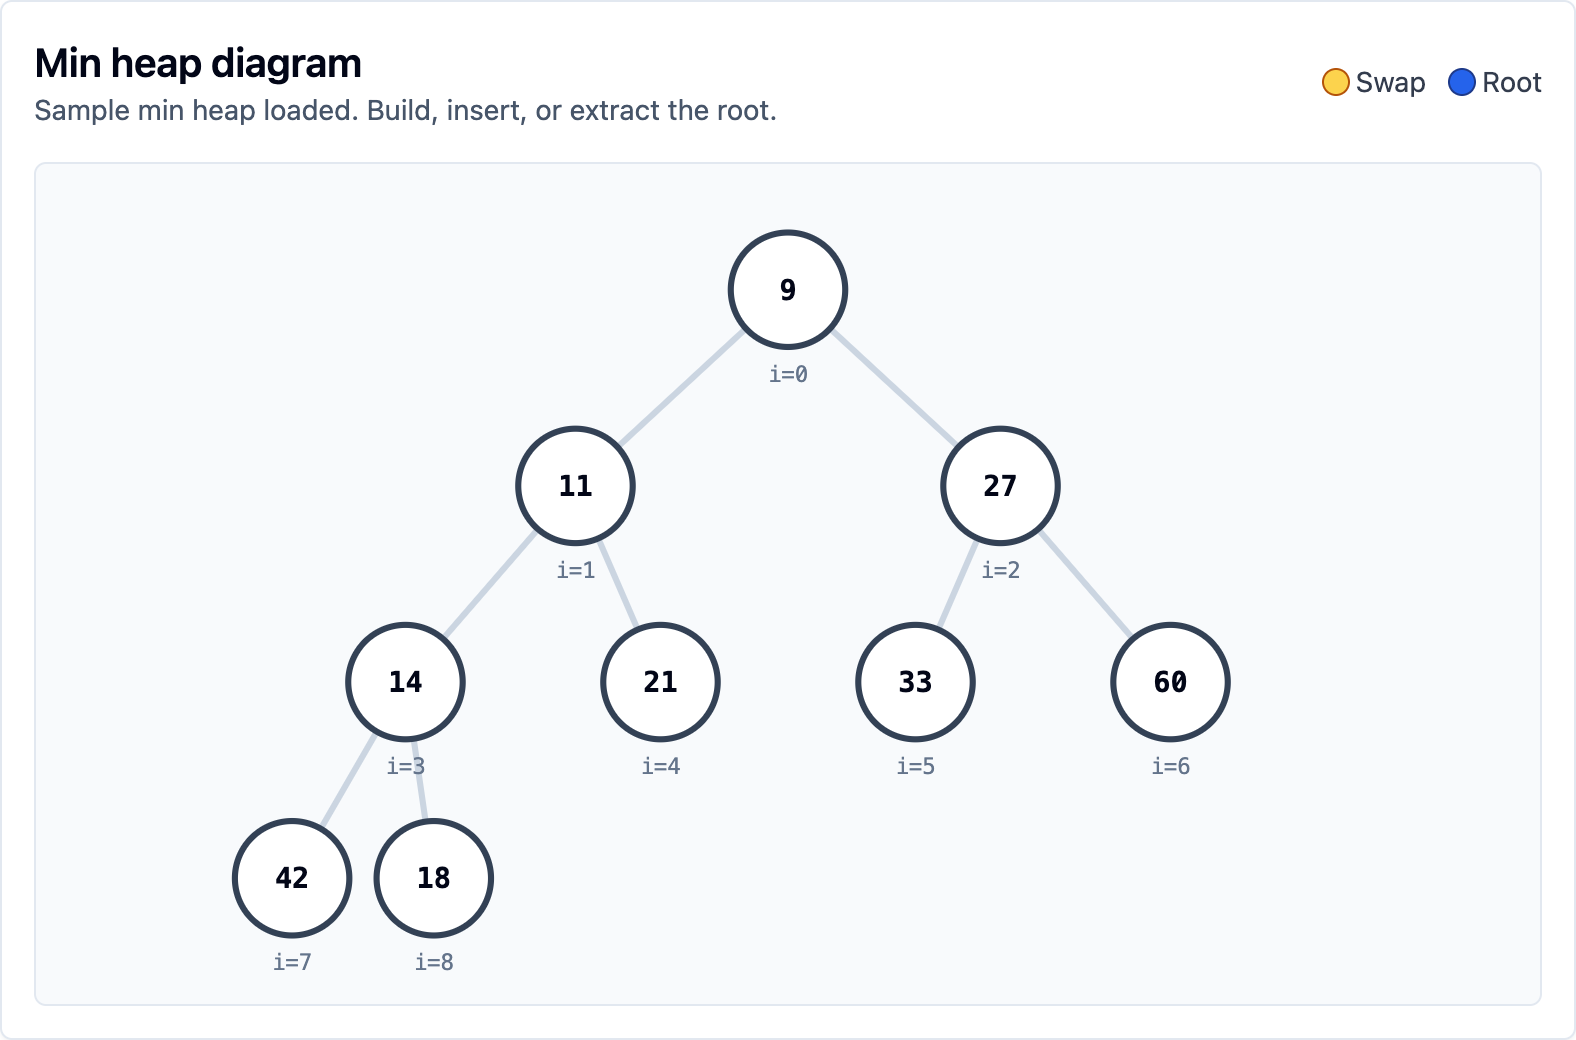 Heap Visualizer Build min and max heaps online. Visualize heapify, insertion and extraction, share an example link, or download the diagram as SVG. Trie Visualizer Build and visualize a trie online. Paste words, search prefixes, autocomplete matches, and inspect how a prefix tree stores strings. Segment Tree Visualizer Visualize segment tree range sum queries online. Build a tree from an array, inspect overlap decisions, and preview point updates. Fenwick Tree Visualizer Visualize Fenwick tree and Binary Indexed Tree range sums online. Build BIT slots, trace prefix jumps, and preview point updates. Sparse Table Visualizer Visualize sparse table range minimum and maximum queries online. Build power-of-two levels and inspect the two blocks used for RMQ. Interval Tree Visualizer Visualize interval tree overlap search online. Build an augmented BST, inspect subtree max values, and trace interval overlap queries.
Related tool hubs
Algorithm Visualizers FAQ
An algorithm visualizer is an interactive tool that shows each important state change while an algorithm runs, such as comparisons, swaps, pointer movement, table updates, or graph relaxations.
Yes. The RavensMove algorithm visualizers are free browser tools and do not require an account.
Start with binary search, sorting, stack and queue, or graph BFS DFS if you are learning fundamentals. Move to dynamic programming, shortest paths, and range-query structures after that.